Analytics module
This section provides information on server usage, analytics executable files, and analytics streams.
Servers
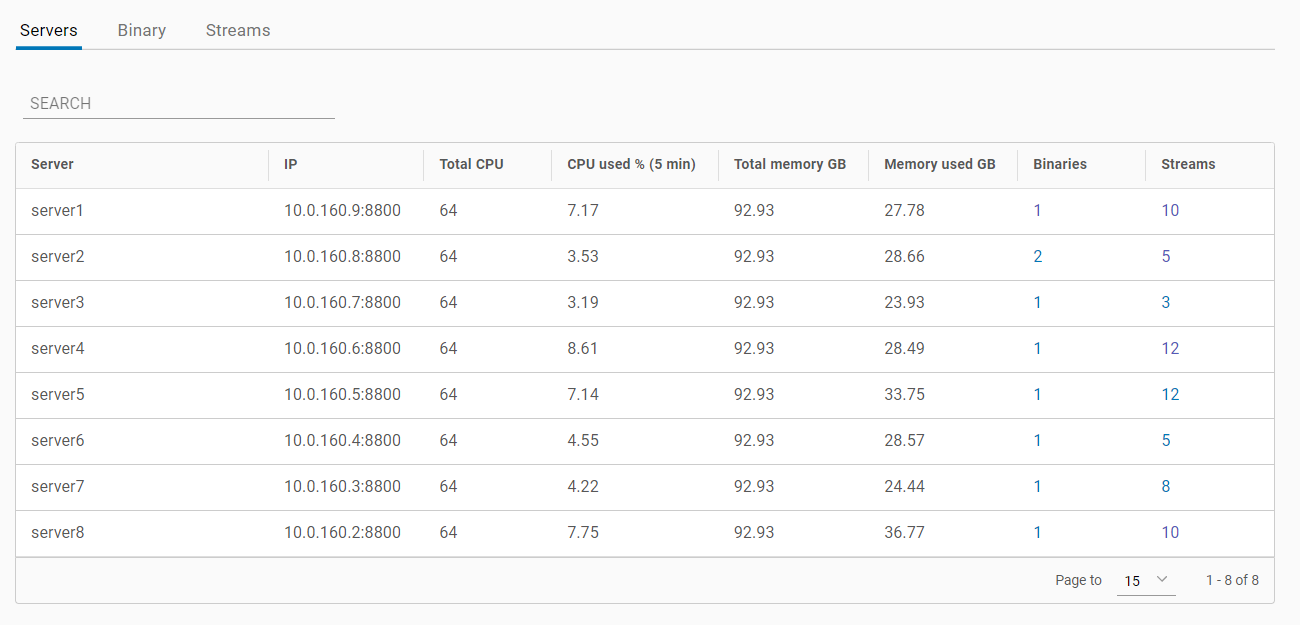
The «Servers» tab displays a table of information about the analytics servers in use. The table includes the following columns:
Server name
Server IP address
Number of CPUs allocated for binary files
CPU usage in % for the past 5 minutes
Total memory (in GB)
Memory used (in GB)
Executable files: the number of analytics executable files on the server. Clicking on the value will navigate to the «Executable Files» tab, where only the executable files for that server will be displayed
Analytics streams: the number of active streams on the server. Clicking on the value will navigate to the «Streams» tab, where only the streams for the selected server will be displayed
Server search by name and IP address is available.

«Servers» tab
Binary
The «Binary» tab displays a table with information about the analytics executable files. The table consists of the following:
UID of the analytics executable file. Clicking on a row will navigate to the «Streams» tab, where only the streams for that executable file will be displayed
Analytics type: indicates the type of analytics processed by the executable file, such as:
License plate recognition
Face recognition
Queue procession
Damage/overlap/vandalism detection
Visitor counting
Abnormal sound detection
Smoke and fire detection
Motion detection
Line crossing detection
Status: the status of the executable file's operation
Used cores: the number of cores used by the dedicated server
Average CPU load (%): average CPU load of the dedicated server in percentage
Memory used (in GB)
Network in (in KB)
Network out (in KB)
Analytics streams: the number of active streams for that executable file. Clicking on the value will navigate to the «Streams» tab, where only the streams for that executable file will be displayed
Server: the analytics server. Clicking on the value will navigate to the «Servers» tab with automatic filtering for the selected server
Filtering options are available for analytics type, server, and status. Additionally, a search can be performed by UID and server.

«Binary» tab
Streams
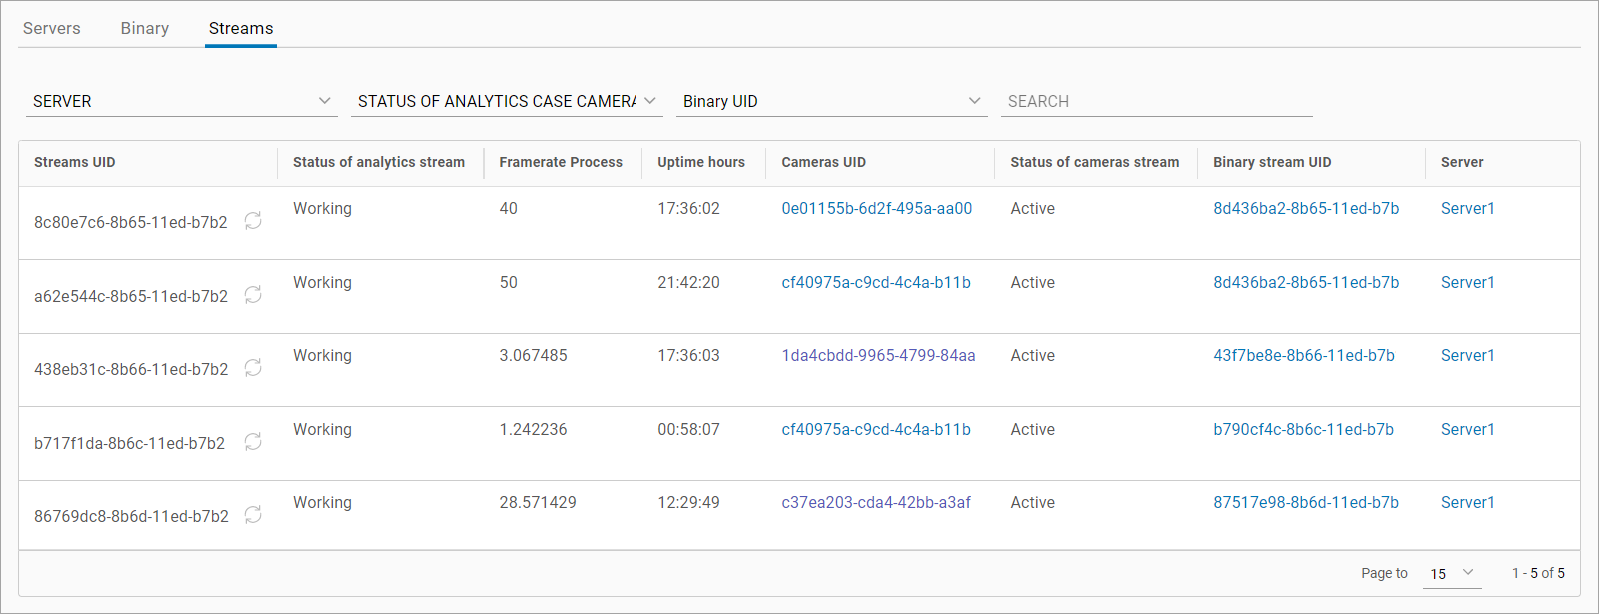
The «Streams» tab displays a table with a list of jobs and streams used for analytics processing. The table includes the following:
UID of the analytics stream
Status of the analytics stream:
active
paused
stopped
inactive
Processing speed (frames per second)
Uptime in hours
UUID of the camera stream from the media server. For streams with an active status, the value is clickable. Clicking on it will navigate to the «Video Streams» tab for the camera involved in the analytics case
Camera stream status:
active
inactive
UID of the executable file. Clicking on the value will navigate to the «Binary» tab with automatic filtering for the selected executable file
Analytics server. Clicking on the value will navigate to the «Servers» tab with automatic filtering for the selected server
For streams with a stopped status, there is an option to restart the stream.
Filtering options are available for server and analytics stream status. Search by UID, stream UID, executable file UID, and server is also available.

«Streams» tab
