Dashboard. Web client user
The Dashboard button, found in the Analytics section, allows you to visualize data for all types of analytics.
.png?inst-v=b63742cc-00c9-4c22-96cb-e64d375db7d7)
Selecting the Dashboard button opens the following page with details:
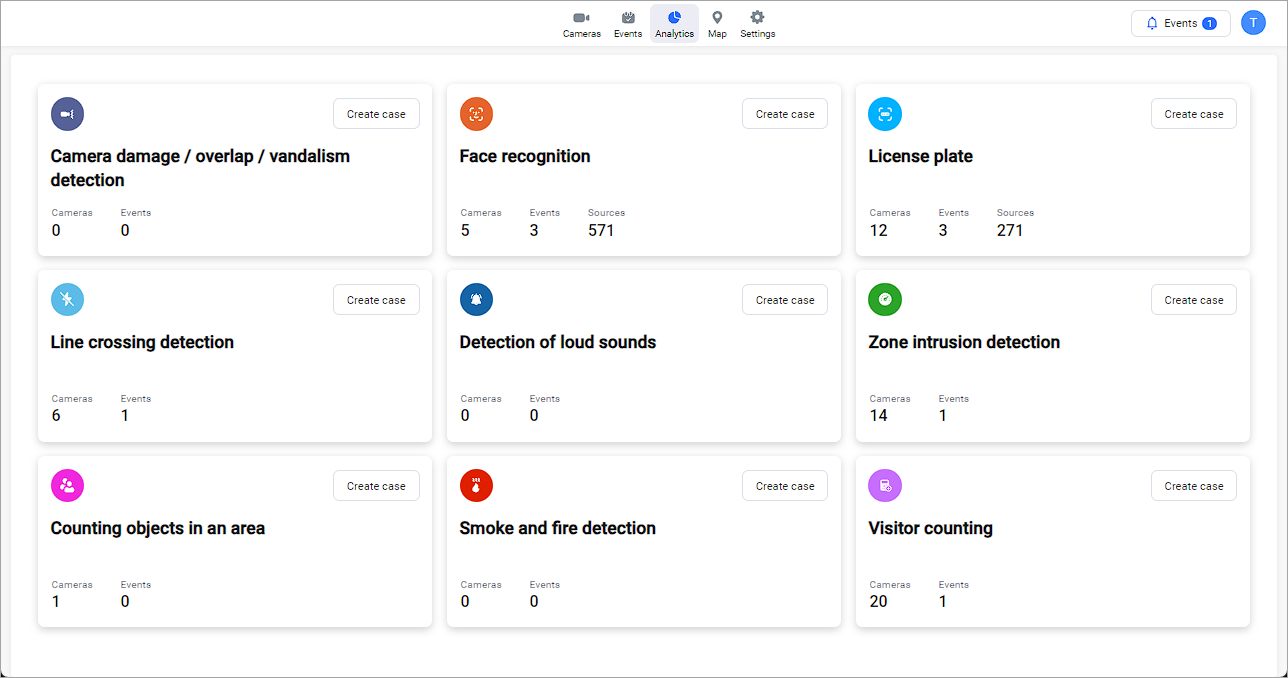
For each type of analytics, the following data is displayed:
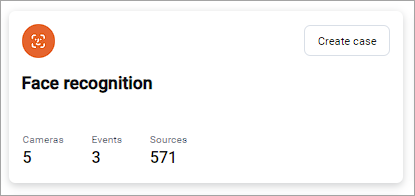
A unique icon represents each type of analytics.
The analytics type name.
The Create case button to initiate creating an analytic case.
The total number of cameras involved in all cases with this type of analytic. Selecting a number navigates you to the Cameras tab. On the tab, you find a list of cameras that can be filtered by analytics type.
The total number of events created in all cases with this type of analytics. Selecting a number navigates you to the Events and reactions tab. On the tab, you find a list of reactions that can be filtered by analytics type.
The total number of unique resources involved in cases with this type of analytics. Selecting a number navigates you to the Analytics resources tab. On this tab, you find a list of resources that can filtered by resource type (Faces and License plates) depending on the type of analytics.