Monitoring
This section contains a link to the infrastructure node monitoring application.
Monitoring is performed through the interaction of the following tools:
Telegraf is an open-source agent used for collecting metrics and data from the system
InfluxDB is a freely distributed time series database (TSDB). All data collected by Telegraf is sent to InfluxDB
Grafana is a tool for graphical representation of metrics, compatible with the InfluxDB database. It is used for creating indicator panels (dashboards) that display specific metrics over a defined period of time
When first accessing the «Statistics» section, you will be redirected to the Grafana login page.
Please consult your Administrator to obtain the login and password for accessing the Grafana dashboard.
Monitoring System Login Screen
To view the collected metrics, follow these steps:
Click on the «Dashboards» button to open the menu
Select «Browse» to access the list of panels
Click on the desired panel's name
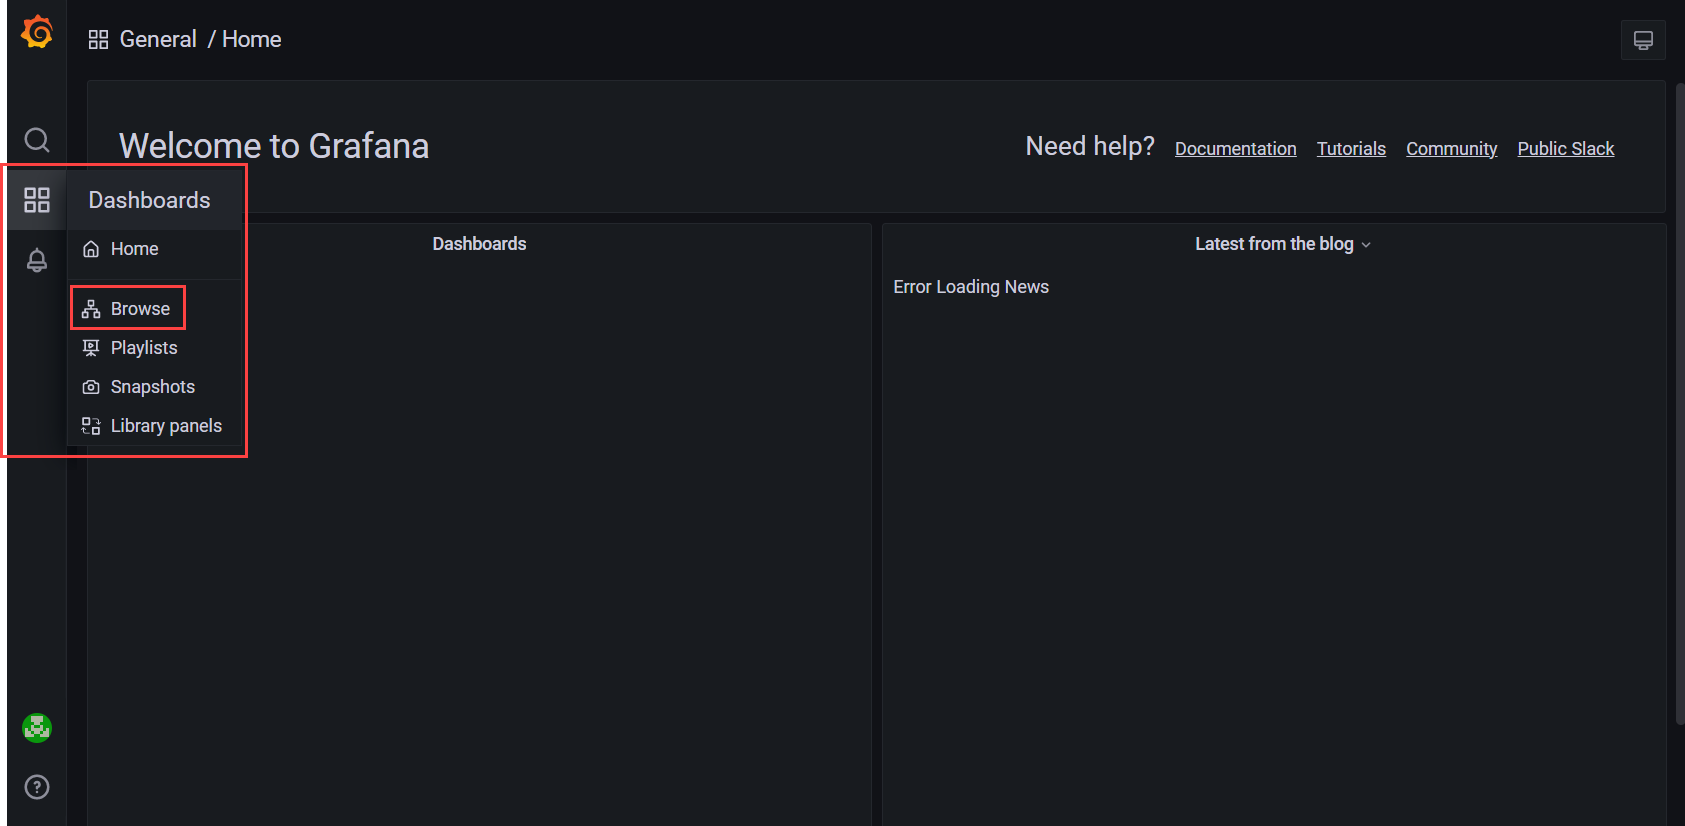
Accessing the Panel List from the Menu
By default, three sets of dashboards are provided.
Infrastructure Monitoring
This set is designed for monitoring configurable infrastructure units such as areas, regions, buildings, groups, etc.
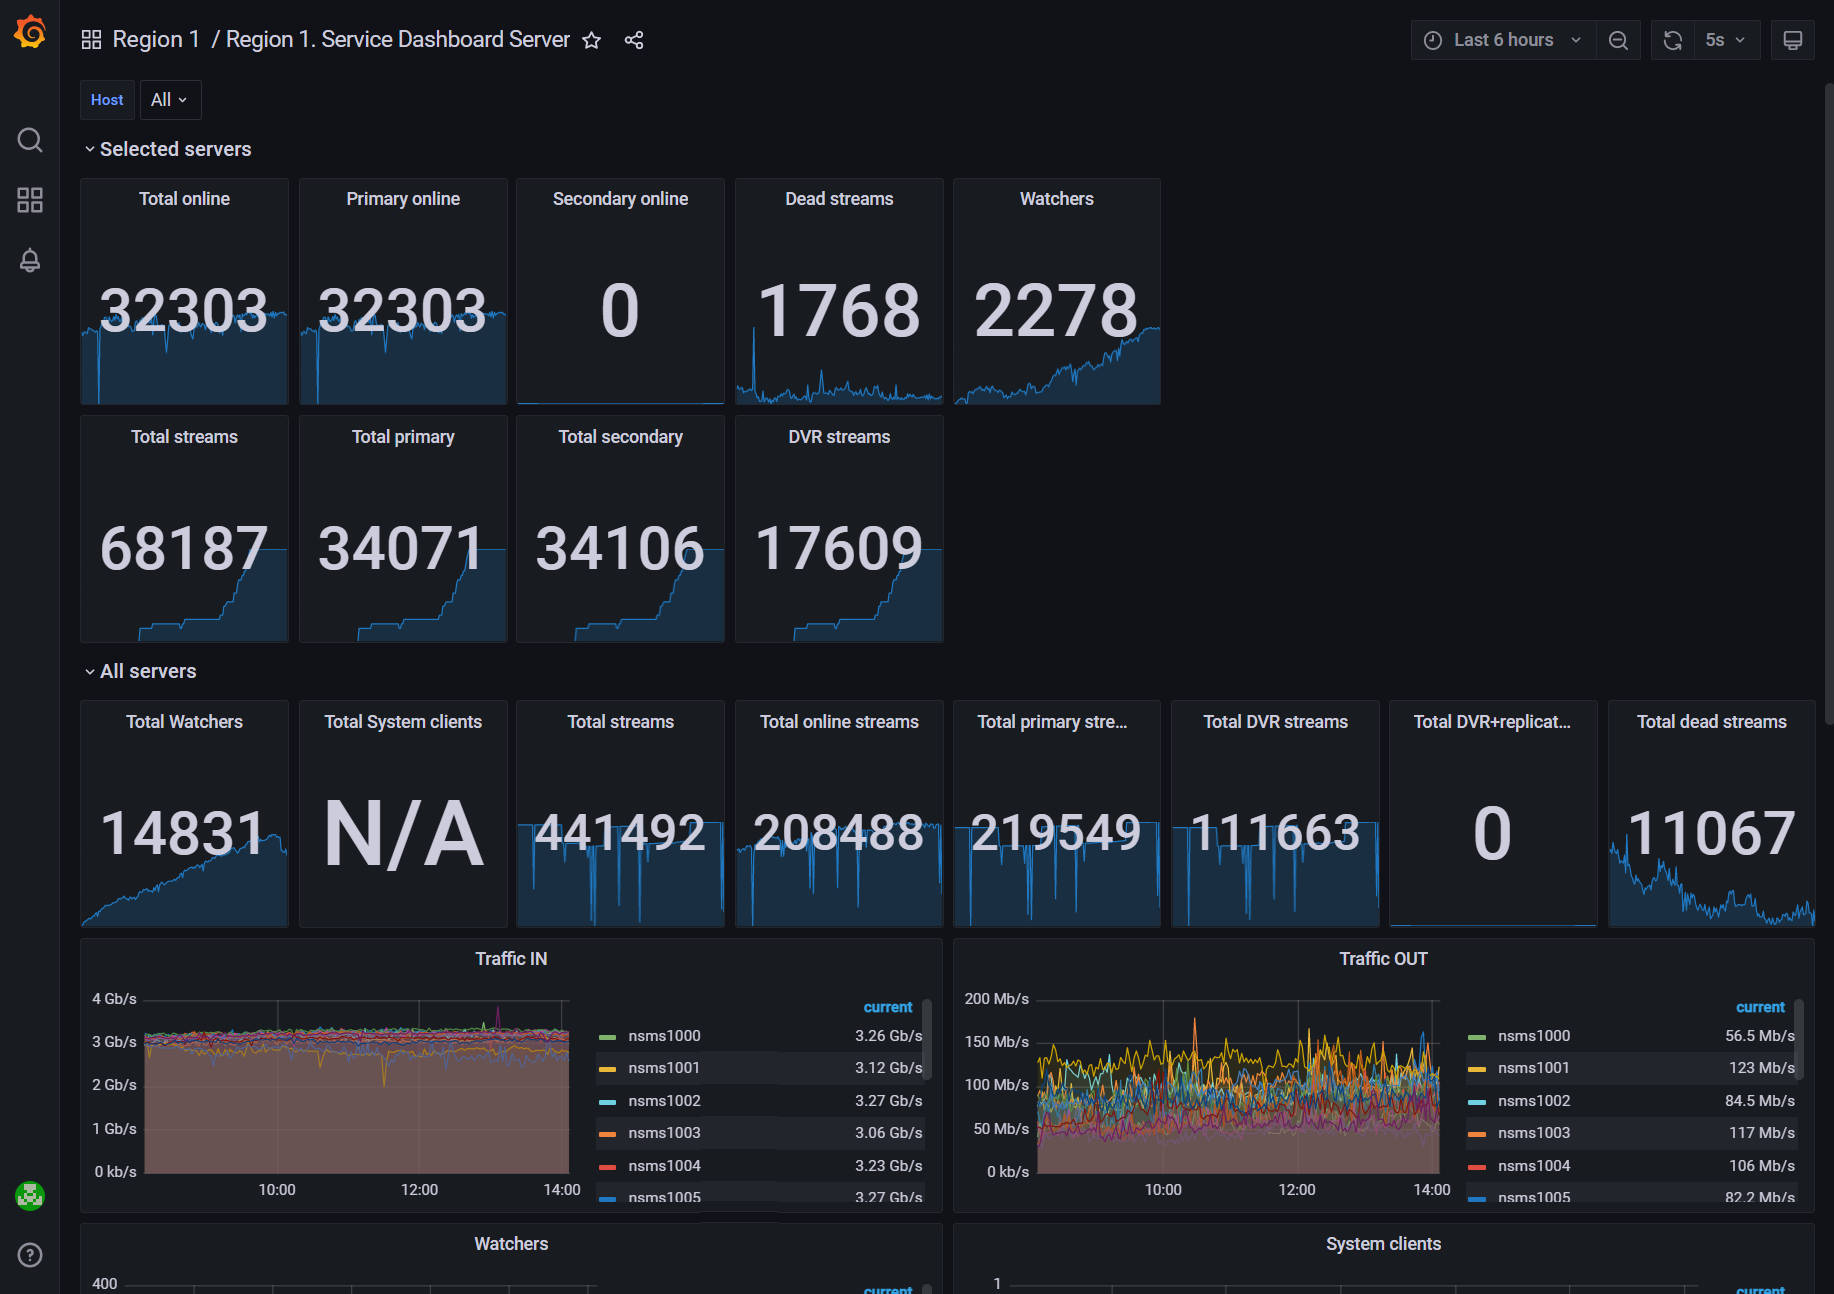
«Service Dashboard Server» Dashboard
This set includes the following dashboards:
Server: region cluster, monitoring of Mediaserver service parameters such as version, CPU load, memory, socket statistics
Common indicators, traffic statistics on media servers (overall and per each media server)
Service Dashboard Server, statistics on cameras, streams, users, traffic, and viewers
3 days storage usage forecast, a three-day forecast of disk space utilization
Disks health, monitoring of disk errors (HDD and SSD)
System dashboard: region cluster, monitoring of server metrics (memory, processes, network, disks, etc.)
Alerts
This set contains dashboards for monitoring and alert rules configured for deviations from acceptable values.
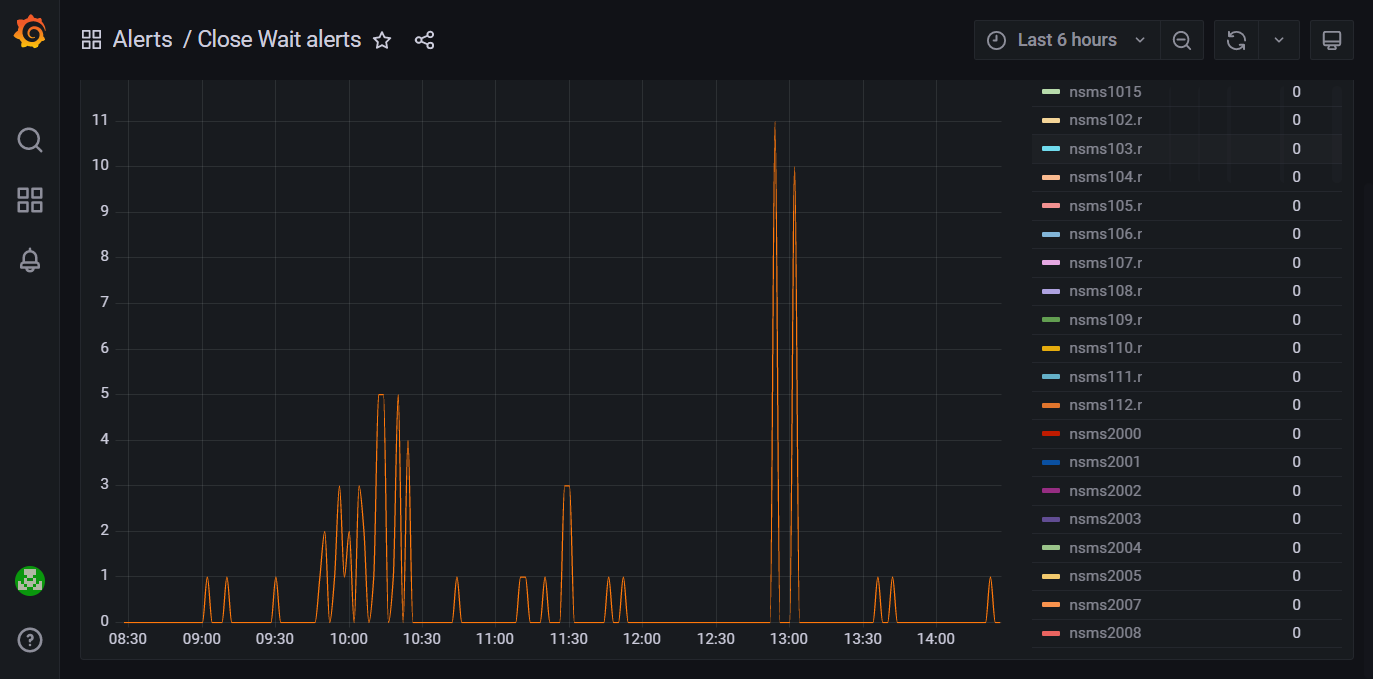
«Close Wait alerts» Dashboard
Close Wait alerts, monitoring of the close_wait parameter for all media servers and alerts in case of exceeding the threshold value
Disk Usage alerting, monitoring of disk space usage and alerts in case of exceeding the threshold value
Service state & input traffic, monitoring of incoming traffic to the server and alerts in case of decreasing below a certain value
Monitoring
This set contains dashboards for monitoring various performance indicators and service status in the Production installation.
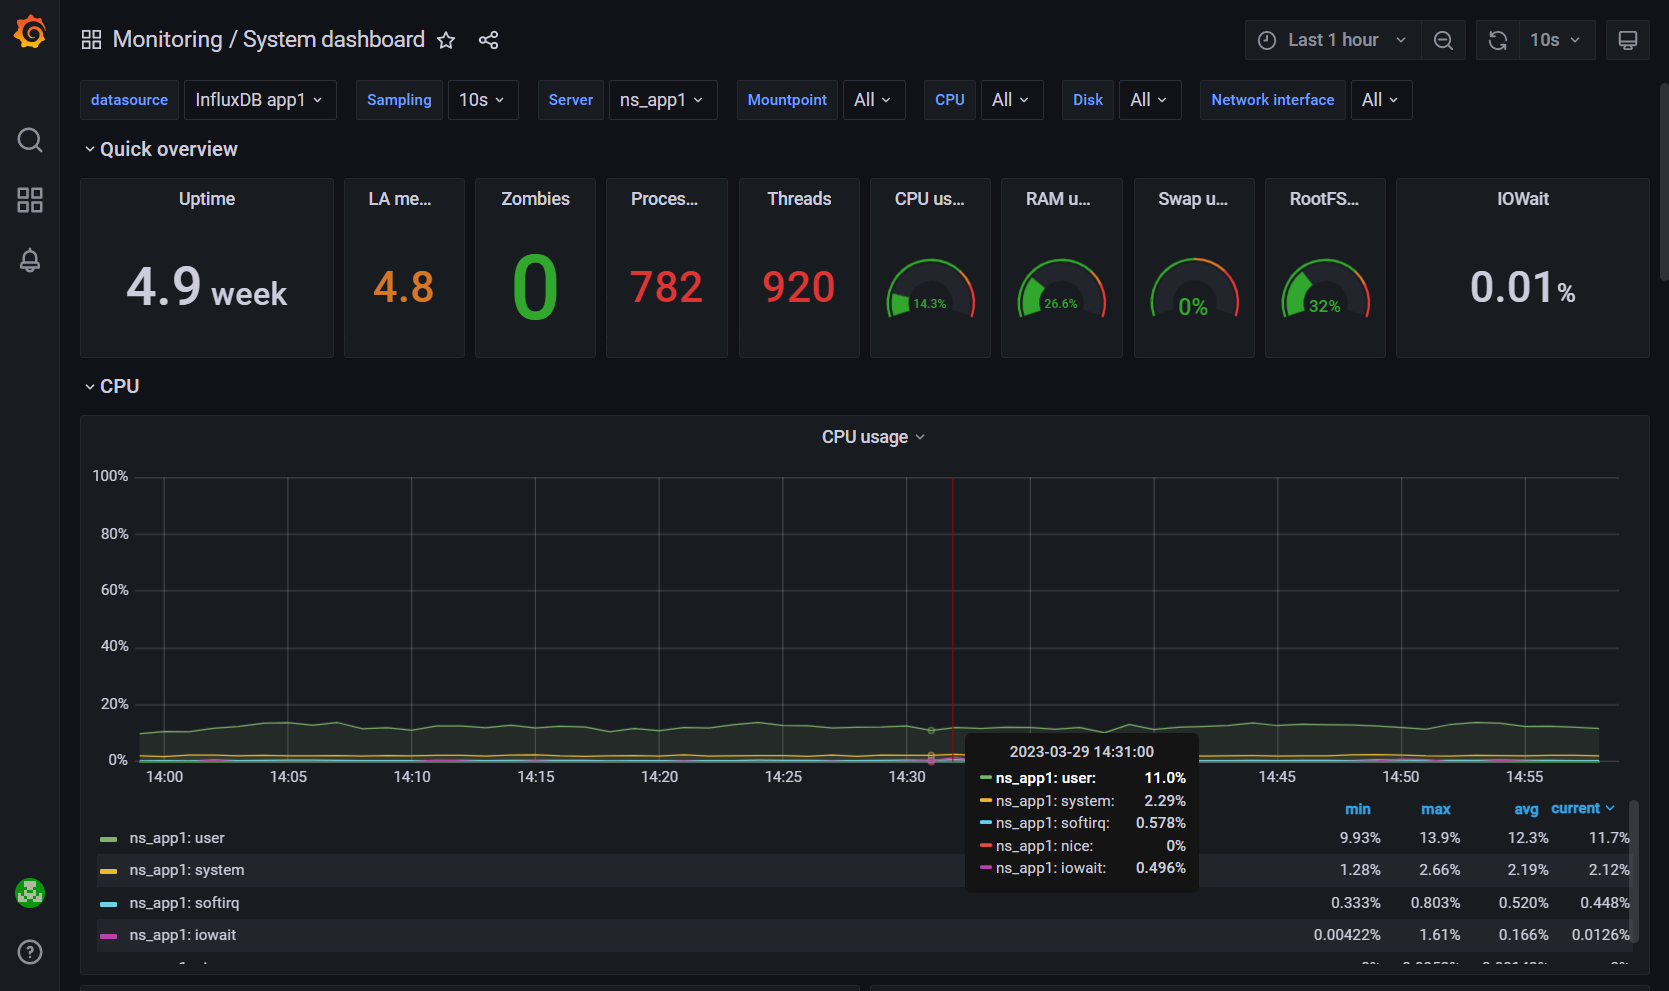
«System dashboard» Dashboard
DHCP, monitoring of the DHCP service status and its operational statistics
NS_APP Monitoring, monitoring of CPU and memory usage by resource-intensive processes
Percona cluster, monitoring of the Percona cluster state (a three-node DB cluster) and alerts for individual node unavailability
Supervisor processes monitoring, monitoring of processes launched through Supervisor on two App servers
System dashboard, monitoring of server metrics (memory, processes, network, disks, etc.)