The License plate analytics type. View and edit
View a case
To view an analytics case of the License plate analytics type, you can choose between table and tile display modes. The tile display mode is set as the default. Both tile and table display modes allow you to set the number of items displayed per page (15, 25, 50, and 100).
To switch display modes, select the corresponding button .png?inst-v=1d934989-adc9-47d4-b93e-1c2e7354ae81) .
.
In table mode, each line contains the following information:
An image at the time of the event.
A name of the event.
A detected car number.
A flag image and a country code.
A name of the resource/group.
A camera name
A similarity percentage of the captured image and the reference.
A date and time of an event.
.png?inst-v=1d934989-adc9-47d4-b93e-1c2e7354ae81)
Table mode
In the tile view, each tile contains the following details:
An image at the time of the event.
A flag image and a country code.
A name of the resource.
A name of the resource group.
A name of the event.
A camera name.
A date and time of an event.
A similarity percentage of the captured image and the reference.
.png?inst-v=1d934989-adc9-47d4-b93e-1c2e7354ae81)
Tile mode
Select an image to view it full screen. Both the camera image and the analytics resource image will be displayed.
The table data can be sorted by groups, event types, dates, cameras, resources, and similarity percentages. It is also possible to perform search in the Search field.
The Similarity percentage filter is helpful when there are multiple possible matches for the recognized object. You can specify only lower or upper limit (with a value not exceeding 100%).
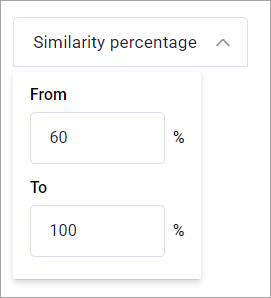
Filtering by similarity percentage
You can access the camera archive by selecting a camera name in any display mode.
Filters
You can filter the information to be displayed with the following filters:

Filters
Selecting a camera or multiple cameras will filter the events captured by these cameras.
Setting a specific time period will filter the events captured within the specified period.
Selecting a group or multiple groups will filter the events in which the selected resource groups were used.
Selecting resources will filter the events in which the selected resources were used for matching.
Selecting the specific events will filter only the relevant events.
Setting the Similarity values will filter the events with a relevant percentage match that fall within the specified limit.
Edit a case
To edit a case, select the Settings button when viewing an analytics case.
Introduce all necessary changes and select Save to save the changes.
You can edit all the previously specified settings, except for changing the analytics type in step 1.
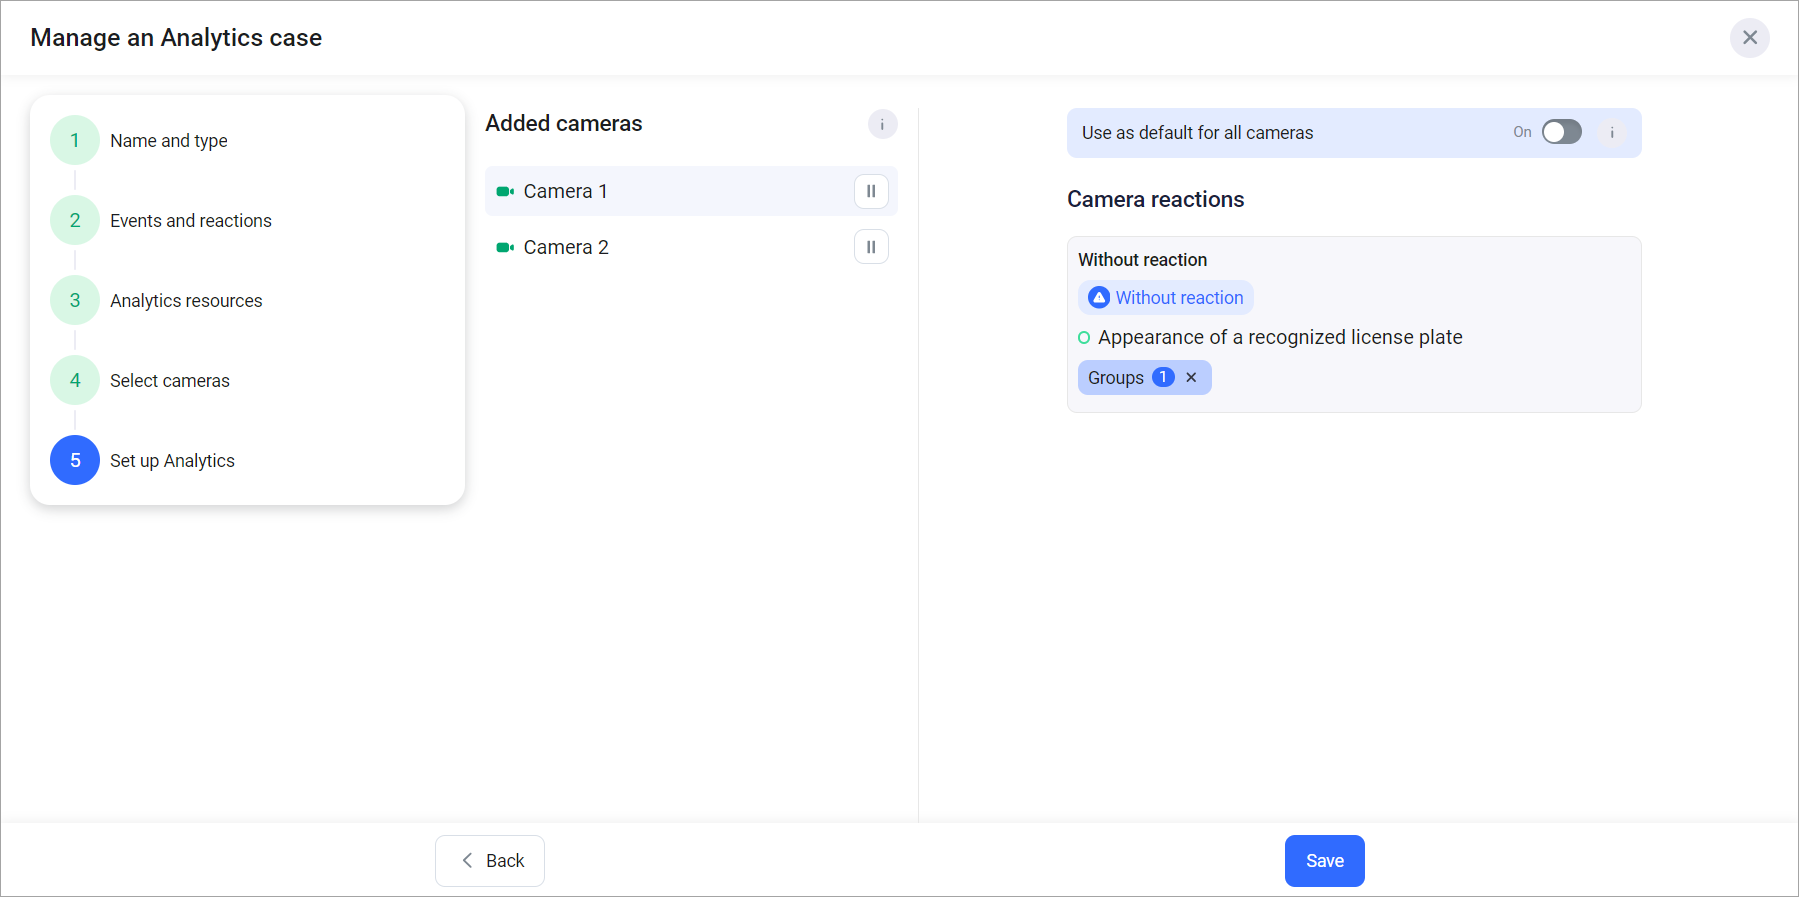
Editing the case of the License plate analytics type
When you are managing a case and decide to remove a camera with recorded events, you are required to choose a specific method for the camera’s deletion.
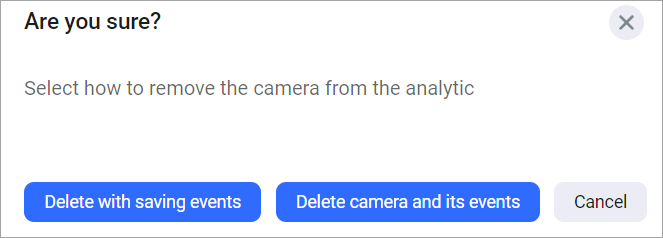
Deleting the camera
Delete camera with saving events.
Delete camera and its events.
As a result of selecting the Delete with saving events option, all the events that were associated with this camera will be displayed in the analytics case. These events will be taken into account in a generated report, when displaying the list of events. It will be possible to navigate and view the archived event from the list of events.
If you select the Delete camera and its events option, all events that were associated with this camera will be completely deleted.
Generate a report
To generate a report, select the Generate report button.
Complete the opened form and select Submit.
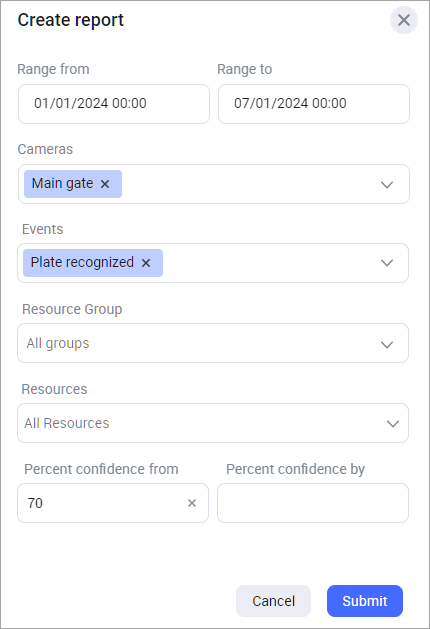
Setting up the report
When the report is ready, you’ll see a notification with a link to download it to your device. Select the link, and the report will be downloaded in an Excel file.
Stream settings
Selecting the Stream settings button opens the Analytics case status panel that contains additional information about the current case and its cameras.
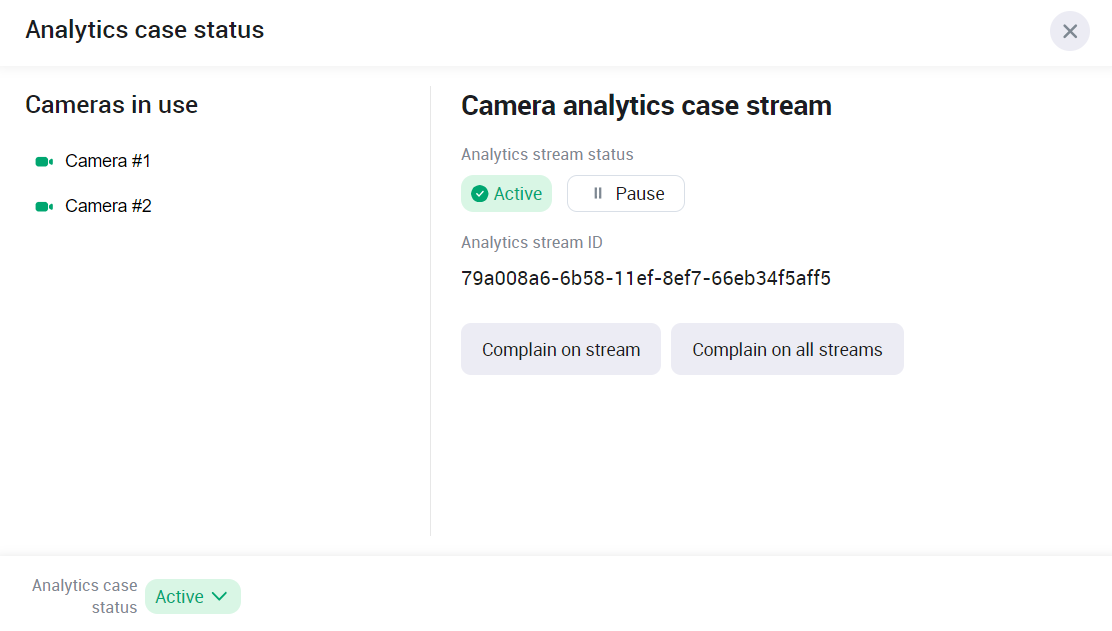
The Analytics case status
The following details are available for each camera added to the case:
A status of an analytics stream. When the analytics stream status is Active, the Pause button will be available.
An Analytics stream ID.
At the left bottom, you can find the status of the analytics case. You can pause an Active analytics case. As a result, all active analytics case streams of all the cameras of this case will be paused as well.
You can report issues on each or all the streams to the support team.
To report an issue on a specific stream:
Select Complain on steam of the relevant stream.
On the opened from, select the complaint reason:
Analytics events do not arrive. Analytics stream is inactive.
Analytics events do not arrive. Analytics stream is active.
.png?inst-v=1d934989-adc9-47d4-b93e-1c2e7354ae81)
Complete the form
Select Complain.
As a result, the complaint will be forwarded to the support team.
To report an issue for all the available streams:
On the Analytics case status panel, select Complain on all streams.
On the opened from, select the complaint reason:
Analytics events do not arrive. Analytics stream is inactive.
Analytics events do not arrive. Analytics stream is active.
.png?inst-v=1d934989-adc9-47d4-b93e-1c2e7354ae81)
Select the reason
Select Complain.