
In the Reports section, you can generate and export various types of reports to your device in Excel format. Reports are grouped into logical categories: Cameras, Media Servers, Intercoms, Users, and System. This structure helps you navigate data faster and find the required metrics with ease.
Generated reports are stored within their respective sections and remain available for download for two months.
Cameras
About cameras
In this section, you can generate a report with details about all platform cameras, including information about camera streams. The report is generated based on the current system date.
All permissions listed below are required for the administrator to generate this report:
-
Cameras > View camera tree, View camera, Camera search.
-
Servers > View media server.
-
Media server groups > Viewing a list of media server groups.
-
Clusters > View list of clusters.
To generate a report, follow the steps:
-
Select the filter to generate a report:
-
By media servers. Refine the selection by choosing a specific mediaserver group, cluster, and mediaserver.
-
By camera tree. From the drop-down list, select the relevant branches.
-
Select Generate report.
As a result, a notification will appear at the bottom of the window: “File generated successfully. Report link”. Select Report link to download the .xlsx file to your device.
An example of a generated report:
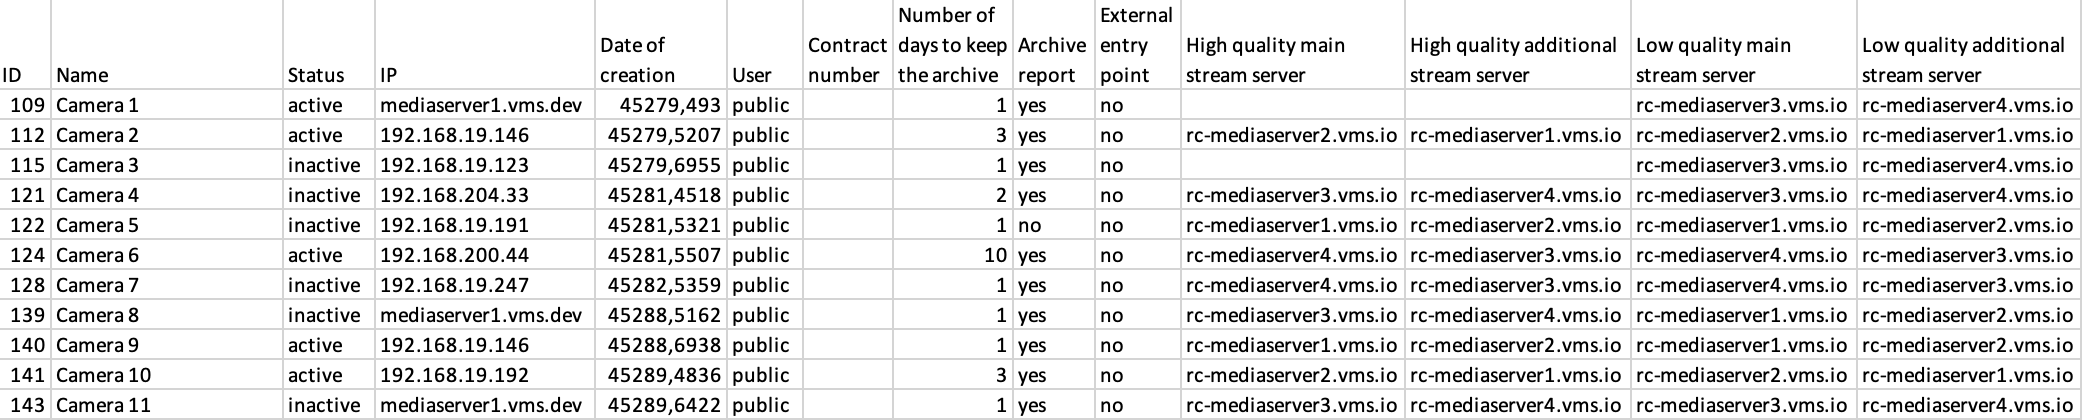
When the report includes 50,000 cameras or fewer, it is generated in Excel format. If the number of cameras exceeds 50,000, the report is generated as a CSV file.
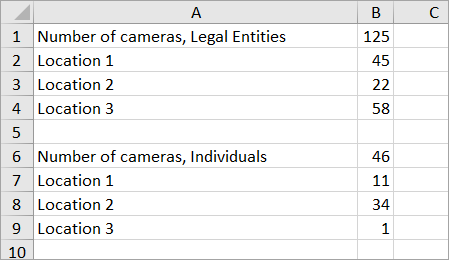
About cameras for the period
In this section, you can generate a report with details about the number of cameras added during the selected time period.
To generate a report:
-
Specify the start and end dates for the reporting period.
-
Select Generate report.
As a result, a notification will appear at the bottom of the window: “File generated successfully. Report link”. Select Report link to download the .xlsx file to your device.
An example of a generated report:
About inactive cameras
In this section, you can generate a report with details about the cameras with the Inactive status. The report is generated based on the current system date.
To generate a report, select Generate report. As a result, a notification will appear at the bottom of the window: “File generated successfully. Report link”. Select Report link to download the .xlsx file to your device.
An example of a generated report:

Media servers
About loading channels of media servers
In this section, you can generate a report with details about the load on all media servers that meet the following conditions:
-
The status is Active
-
Distribution is enabled
The report is generated based on the current system date.
To generate a report, select Generate report. As a result, a notification will appear at the bottom of the window: “File generated successfully. Report link”. Select Report link to download the .xlsx file to your device.
An example of a generated report:

About loading media servers
In this section, you can generate a report with details about the load on all media servers with the Active status and the specified cluster.
The report is generated based on the current system date.
To generate a report, select Generate report. As a result, a notification will appear at the bottom of the window: “File generated successfully. Report link”. Select Report link to download the .xlsx file to your device.
An example of a generated report:

About media servers
In this section, you can generate a report with details about the media servers on the platform.
The report is generated based on the current system date.
To generate a report, select Generate report. As a result, a notification will appear at the bottom of the window: “File generated successfully. Report link”. Select Report link to download the .xlsx file to your device.
An example of a generated report:

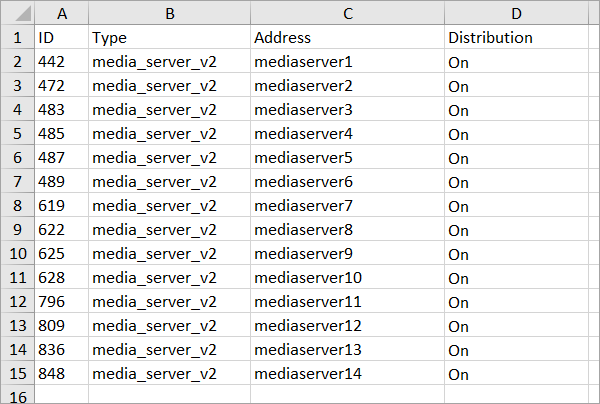
About inactive servers
In this section, you can generate a report with details about media servers with the Inactive status. The report is generated based on the current system date.
To generate a report, select Generate report. As a result, a notification will appear at the bottom of the window: “File generated successfully. Report link”. Select Report link to download the .xlsx file to your device.
An example of a generated report:
Intercoms
About intercoms
In this section, you can generate a consolidated report for all intercoms on the platform, including information about intercom camera streams and associated media servers.
To generate a report:
-
Specify the start and end dates for the reporting period.
-
In the Location filter, select all required locations for which the report is needed.
-
Select Generate report.
As a result, a notification will appear at the bottom of the window: “File generated successfully. Report link”. Select Report link to download the .xlsx file to your device.
About the number of intercoms for the period
In this section, you can generate reports on the number of intercoms that were added and deleted within the selected period.
To generate a report:
-
Specify the start and end dates for the reporting period.
-
Select Generate report.
As a result, a notification will appear at the bottom of the window: “File generated successfully. Report link”. Select Report link to download the .xlsx file to your device.
An example of a generated report:
.png?cb=54097f6d05f11ec3687d46d4cb239560)
Users
User activity
In the User activity section, the administrator can generate and download a report detailing user interactions with cameras within a specified period.
To generate a report:
-
Specify the start and end dates.
-
If a specific camera is required, select it in the Cameras drop-down list.
-
Select Generate report. As a result, a notification will appear at the bottom of the window: “File generated successfully. Report link”. Select Report link to download the .xlsx file to your device.
An example of a generated report:
.png?cb=52b88c2e4f7df45ba9f78d49c5330281)
The report summarizes event activity for a given camera, detailing the total occurrences of various event types during the selected period.
For the complete list of event types that can be found in the report, see the User actions. Cameras article.
About users
In the section, you can generate and download a report detailing the total number of users and the allocation of cameras and licenses per user within a specified period.
The report generation settings allow data to be grouped using two filters:
-
Detailization by users
-
Aggregation by service types
Detailization by users
The tool generates a consolidated report for all user types for the selected period, including:
-
Login, status, and creation date of each account.
-
Distribution of cameras, including their number and location.
-
License statistics, including the number of used and total licenses.
-
Detailed breakdown of connected services, including availability and location.
To generate a report:
-
Select the Detailization by users filter.
-
Specify the start and end dates for the reporting period.
-
Select the Generate report button.
-
As a result, a notification will appear at the bottom of the window: “File generated successfully. Report link”. Select Report link to download the .xlsx file to your device.
Aggregation by service types
The tool generates a consolidated report filtered by the selected service types: Video surveillance, Intercoms, L1/L2/L3 Analytics.
To generate a report:
-
Select the Aggregation by service types filter.
-
From the Service type drop-down list, select all necessary services to generate a report. Default selection – if no service type is selected, the report includes all available service types.
-
Select the Generate report button.
-
As a result, a notification will appear at the bottom of the window: “File generated successfully. Report link”. Select Report link to download the .xlsx file to your device.
System
About devices
The report exports information about configured access control devices.
The administrator requires the following permissions to be able to download this report:
-
Administrators group: View reports.
-
BLE devices group: View BLE device list.
-
Actuators group: View actuator list (in future releases).
The following report filters are available:
-
Device type:
-
BLE devices
-
Actuators (in future releases)
-
-
Period:
-
Start date and end date of the period during which the devices are created.
-
Select Generate report to generate the report.
-
As a result, a notification will appear at the bottom of the window: “File generated successfully. Report link”. Select Report link to download the .xlsx file to your device.
.png?cb=beac6cdbb6cebc62e9e5096cc8b30143)
About licenses
In this section, you can generate consolidated information on the status and utilization of licenses in the system for video surveillance cameras, analytics at each hierarchy level, access point types and associated devices, BLE devices and keys.
The reports provide data on the number of licenses (total, in use, not in use (available) and shared (allocated), as well as statistics on license usage over a selected period.
The following filters are available for generating report data:
-
All licenses – displays current metrics as of the system date.
-
By period – allows you to export data and usage dynamics for the selected time range.
To generate a report:
-
Select the required filter: All licenses or For period. For the For period filter, specify the required dates.
-
Select Generate report. As a result, a notification will appear at the bottom of the window: “File generated successfully. Report link”. Select Report link to download the .xlsx file to your device.
About the system
In this section, you can generate a report with details about the system components: cameras, intercoms, media servers, DHCP servers, NTP servers, users, BLE devices, and so on.
The report is generated based on the current system date.
To generate a report, select Generate report. As a result, a notification will appear at the bottom of the window: “File generated successfully. Report link”. Select Report link to download the .xlsx file to your device.
About the system events
In this section, you can generate a report that contains details about system events grouped as follows:
-
System events of users
-
System events of cameras
-
General system events
To generate a report:
-
Specify the start and end dates for the report.
-
Select the event group. If required, select specific events. The list of events depends on the selected group.
For the camera events group, you can specify the relevant cameras.
If no events or cameras are selected, the report is generated based on all events and cameras.
-
To generate a report, select Generate report. As a result, a notification will appear at the bottom of the window: “File generated successfully. Report link”. Select Report link to download the .xlsx file to your device.