The Zone intrusion detection analytics type. View and edit
View a case
When viewing a case of the Zone intrusion detection analytics type, a table contains the following information:
An event image (a frame at the moment of the event and a frame 1 second before the event).
An event name.
A camera name.
A date of an event creation.
You can filter the events list according to the selected camera or a set period.
.png?inst-v=1d934989-adc9-47d4-b93e-1c2e7354ae81)
An analytics case
To view an image full screen, select its thumbnail.
The detected object will be highlighter green on the image.
Select a camera name to access its archive at the time of the event.
Filters
You can filter the information to be displayed with the following filters:
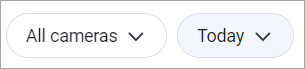
The filters
Selecting a camera or multiple cameras will filter the events captured by these cameras.
Setting a specific time period will filter the events captured within the specified period.
Edit a case
To edit a case, select the Settings button when viewing an analytics case.
Introduce all necessary changes and select Save to save the changes.
You can edit all the previously specified settings, except for changing the analytics type in step 1.
.png?inst-v=1d934989-adc9-47d4-b93e-1c2e7354ae81)
Editing a case
When you are managing a case and decide to remove a camera with recorded events, you are required to choose a specific method for the camera’s deletion.
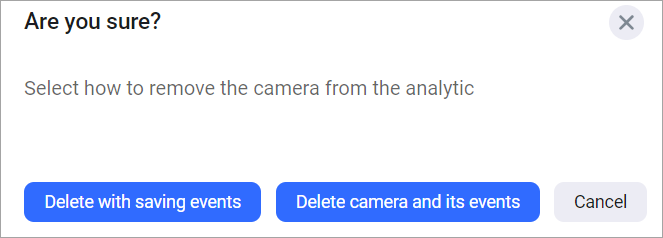
Deleting the camera
Delete camera with saving events.
Delete camera and its events.
As a result of selecting the Delete with saving events option, all the events that were associated with this camera will be displayed in the analytics case. These events will be taken into account in a generated report, when displaying the list of events. It will be possible to navigate and view the archived event from the list of events.
If you select the Delete camera and its events option, all events that were associated with this camera will be completely deleted.
Generate a report
To generate a report, select the Generate report button.
Complete the opened form and select Submit.
.png?inst-v=1d934989-adc9-47d4-b93e-1c2e7354ae81)
Complete the opened form
When the report is ready, you’ll see a notification with a link to download it to your device. Select the link, and the report will be downloaded in .XLXS file.
.png?inst-v=1d934989-adc9-47d4-b93e-1c2e7354ae81)
An example of a generated report
Stream settings
Selecting the Stream settings button opens the Analytics case status panel that contains additional information about the current case and its cameras.
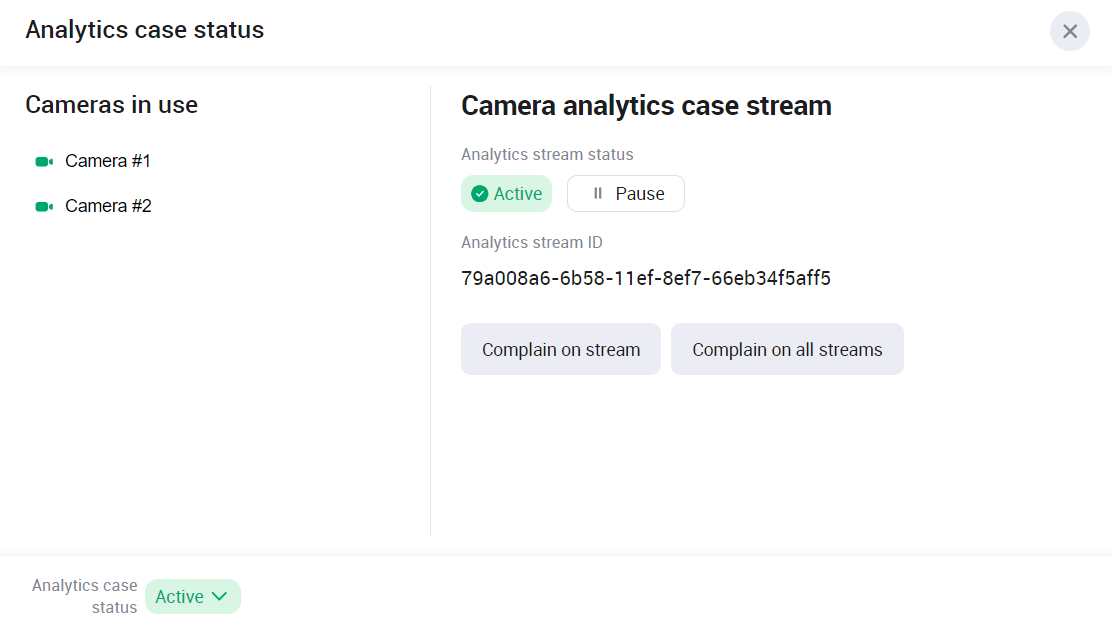
The Analytics case status
The following details are available for each camera added to the case:
A status of an analytics stream. When the analytics stream status is Active, the Pause button will be available.
An Analytics stream ID.
At the left bottom, you can find the status of the analytics case. You can pause an Active analytics case. As a result, all active analytics case streams of all the cameras of this case will be paused as well.
You can report issues on each or all the streams to the support team.
To report an issue on a specific stream:
Select Complain on steam of the relevant stream.
On the opened from, select the complaint reason:
Analytics events do not arrive. Analytics stream is inactive.
Analytics events do not arrive. Analytics stream is active.
.png?inst-v=1d934989-adc9-47d4-b93e-1c2e7354ae81)
Complete the form
Select Complain.
As a result, the complaint will be forwarded to the support team.
To report an issue for all the available streams:
On the Analytics case status panel, select Complain on all streams.
On the opened from, select the complaint reason:
Analytics events do not arrive. Analytics stream is inactive.
Analytics events do not arrive. Analytics stream is active.
.png?inst-v=1d934989-adc9-47d4-b93e-1c2e7354ae81)
Select the reason
Select Complain.